.png)
Simulation
Deformation Profile
Static analysis of stepped shaft showing total deformation distribution. Displacement increases from the fixed end (blue) to the free end (red), with a maximum deformation of 0.0256 mm, indicating elastic behavior.
Key highlights to notice:
- Free end deformation
- Maximum displacement at red region
- Stepped geometry affects stiffness
- Deformation remains within elastic range
.png)
Assembly
Dynamic Results
Modal analysis of the connecting rod showing total deformation at 120 Hz. The contour plot indicates maximum displacement at upper section (red) and minimum at the fixed end (blue).
Key highlights to notice:
- First mode shape at 120 Hz
- Maximum deformation at top region
- Minimum displacement at constrained end
- Smooth deformation transition
Assembly
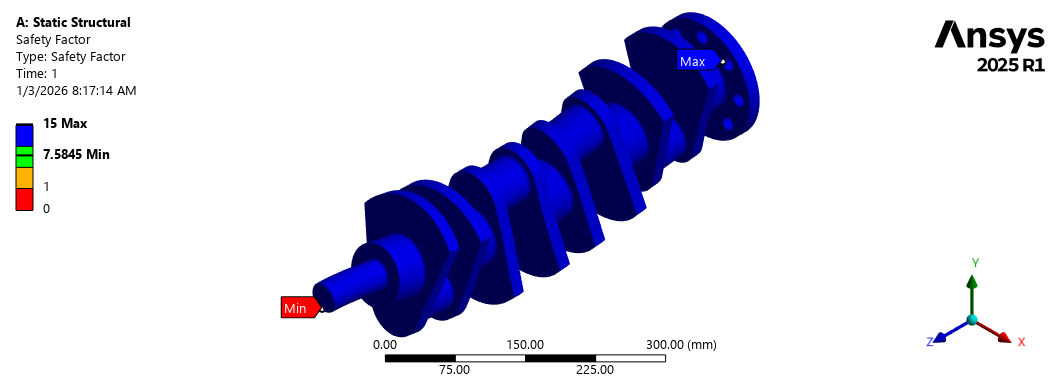
Factor of Safety Results
Static structural analysis showing the safety factor distribution across the shaft assembly. Values range from approximately 7.58 (min) to 15 (max), indicating the component operates well within safe limits.
Key highlights to notice:
- Minimum safety factor ≈ 7.58
- Maximum safety factor = 15
- No critical failure zones observed
- Design remains structurally safe